Leaflet Map: Shopping Malls in Jakarta
If you ask any local person from Jakarta about what they like about the city other than the foods (obviously we have the best foods!), most of them will recommend you to visit the shopping malls.
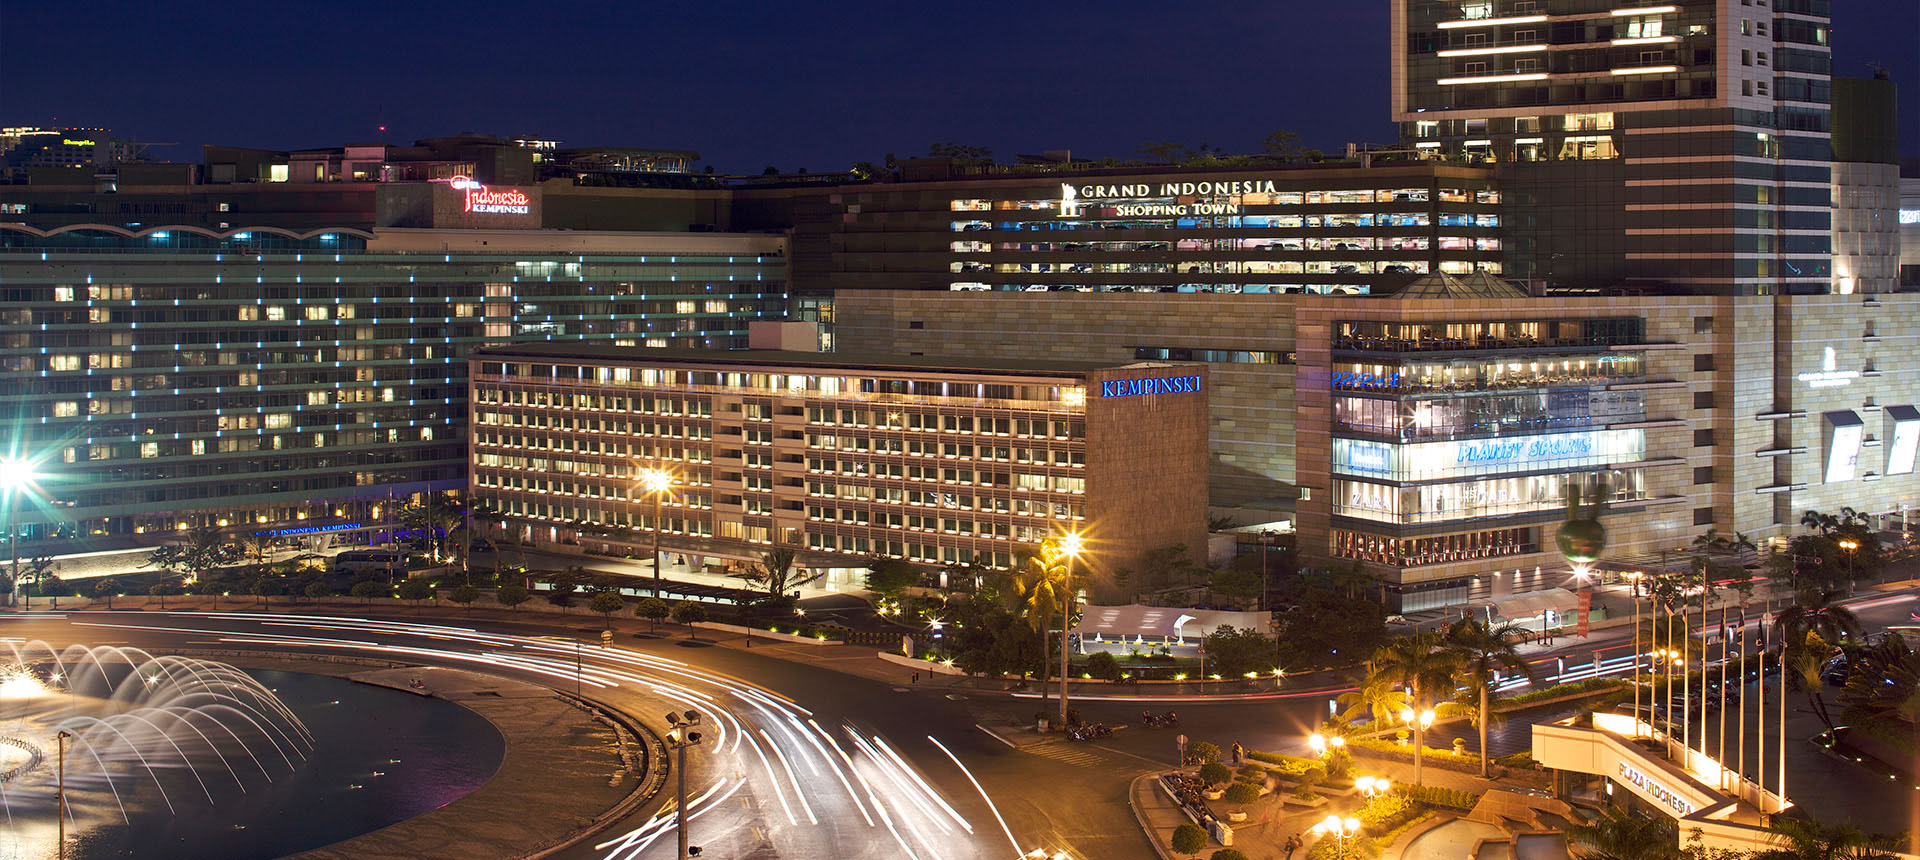
I think the shopping malls in Jakarta are one of the best ones on the planet. This project shows the top 8 most famous shopping malls of Jakarta (according to me) shown in an interactive map.
The shopping malls are shown on the map as icons and can be clicked to take the user to their respective websites. The map can also be freely moved and zoomed in or out. It was created with the Leaflet package from R.
The codes used are fairly short and simple as shown below:
library(leaflet)

mallsIcon <- makeIcon(
    iconUrl = "http://pluspng.com/img-png/png-mall-mall-png-674.png",
    iconWidth = 31*215/230, iconHeight = 31,
    iconAnchorX = 31*215/230/2, iconAnchorY = 16
)

mallsSites <- c(
    "<a href='https://www.malkelapagading.com/'>Mall Kelapa Gading</a>",
    "<a href='http://www.plazaindonesia.com/'>Plaza Indonesia</a>",
    "<a href='http://plaza-senayan.com/'>Plaza Senayan</a>",
    "<a href='https://www.grand-indonesia.com/'>Grand Indonesia</a>",
    "<a href='http://senayancity.com/'>Senayan City</a>",
    "<a href='http://www.taman-anggrek-mall.com/'>Mall Taman Anggrek</a>",
    "<a href='https://www.gandariacity.co.id/'>Gandaria City</a>",
    "<a href='https://www.pondokindahmall.co.id/'>Pondok Indah Mall</a>"
)

jkt_malls <- data.frame(names = c("Mall Kelapa Gading", "Plaza Indonesia", "Plaza Senayan", "Grand Indonesia",
                                   "Senayan City", "Mall Taman Anggrek", "Gandaria City", "Pondok Indah Mall"),
                          lat = c(-6.1575, -6.1938, -6.2255, -6.1950,
                                  -6.2274, -6.1757, -6.2452, -6.2657),
                          lng = c(106.9080, 106.8222, 106.7992, 106.8198,
                                  106.7973, 106.7922, 106.7838, 106.7831))
jkt_malls %>%
    leaflet() %>%
    addTiles() %>%
    addMarkers(popup = mallsSites, icon = mallsIcon)
See the map here:

